Image Details
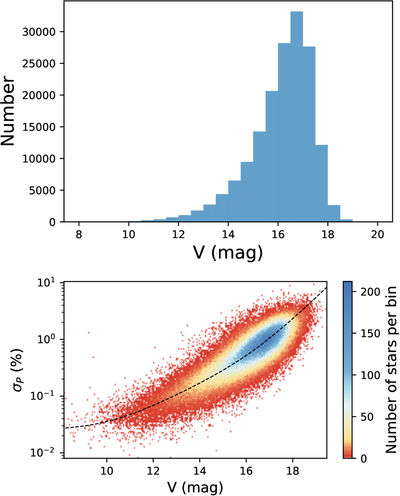
Caption: Figure 1.
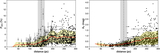
Top: distribution of V-band magnitudes for stars in our polarimetric sample that have counterparts in the Gaia DR3 catalog. Bottom: polarimetric uncertainty (σP) as a function of V-band magnitude. The color scale indicates the number of sources per bin in the density map. The distribution shows the expected behavior of the measurement uncertainties: a systematic floor of ∼0.03% for bright stars, a photon-noise-dominated regime at intermediate magnitudes, and an increasing contribution from sky-background noise toward the faint end. The black dashed curve represents the empirical noise model ﹩{\sigma }_{P}^{2}={\sigma }_{{\rm{sys}}}^{2}+{\sigma }_{{\rm{shot}}}^{2}+{\sigma }_{{\rm{sky}}}^{2}﹩, where ﹩{\sigma }_{{\rm{shot}}}=b\times 1{0}^{0.2(V-{V}_{0})}﹩ and ﹩{\sigma }_{{\rm{sky}}}=c\times 1{0}^{0.4(V-{V}_{0})}﹩, with parameters σsys = 0.025%, b = 0.22, c = 0.10, and V0 = 14.7.
Other Images in This Article
Show More
Copyright and Terms & Conditions
© 2026. The Author(s). Published by the American Astronomical Society.