Image Details
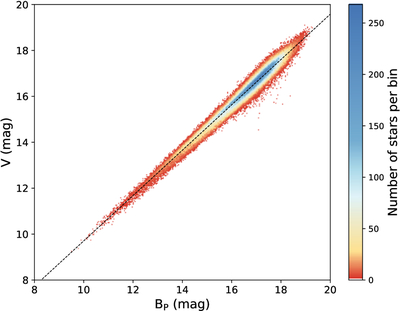
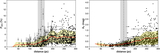
Caption: Figure 2.
Comparison between the V-band magnitudes estimated from our polarimetric observations and the Gaia DR3 BP-band photometry for the cross-matched stellar sample. The color scale indicates the density of points, and the dashed line shows the best-fit linear regression, V = 0.99 BP − 0.17. The tight correlation and small scatter demonstrate the reliability of the V-band magnitude calibration adopted for our optical polarization catalog.
Other Images in This Article
Show More
Copyright and Terms & Conditions
© 2026. The Author(s). Published by the American Astronomical Society.
Copyright ©
2026 Astronomy Image Explorer. All Rights Reserved.