Image Details
Caption: Figure 5.
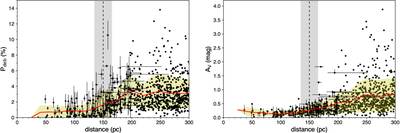
Distance to the R–C cloud. Left: debiased stellar polarization, ﹩{P}_{{\rm{deb}}}=\sqrt{{P}^{2}-{\sigma }_{P}^{2}}﹩, as a function of stellar distance from F. Anders et al. (2022). The red curve shows the mean polarization in 30 pc bins (stepped every 15 pc), while the shaded region represents the ±1σ dispersion. The mean polarization remains low (〈Pdeb〉 ≲ 1%) out to ∼130 pc, after which a clear rise is observed, reaching a plateau near ∼200 pc. Right: visual extinction AV from F. Anders et al. (2022) as a function of stellar distance, showing a similar increase beginning at ∼140–160 pc and saturating beyond ∼200 pc. The red curve and the shaded region have the same meaning as in the panel on the left. In both panels, the vertical gray band marks the inferred distance to the R–C cloud (150 ± 15 pc). Only stars within 200 pc are shown with individual uncertainties to maintain figure clarity. These parallel trends in polarization and extinction independently confirm the location of the R–C cloud and indicate that most of the intervening material lies at the ∼150 pc layer.
Other Images in This Article
Show More
Copyright and Terms & Conditions
© 2026. The Author(s). Published by the American Astronomical Society.