Image Details
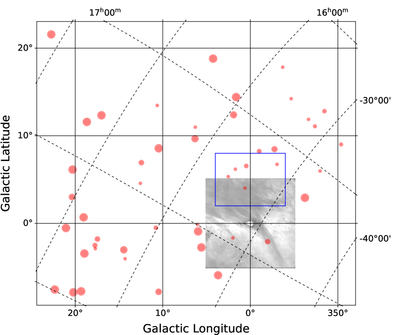
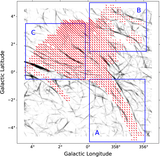
Caption: Figure 4.
Spatial distribution of the stars observed by R. M. Crutcher & D. J. Lien (1984) in the direction of the R–C cloud. The size of each circle is proportional to the Na I column density measured toward that star. The inset shows the region mapped in H I self-absorption by N. M. McClure-Griffiths et al. (2006), while the blue rectangle outlines the area of the Pipe Nebula analyzed by G. A. P. Franco et al. (2010). Only three of the Na I sight lines intersect the H I region studied in this work, underscoring that earlier distance estimates relied on a much broader area than the one considered here.
Other Images in This Article
Show More
Copyright and Terms & Conditions
© 2026. The Author(s). Published by the American Astronomical Society.