Image Details
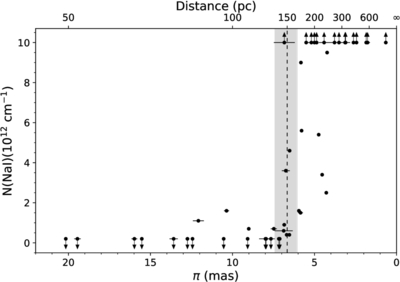
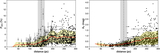
Caption: Figure 3.
Na I D-line column density from R. M. Crutcher & D. J. Lien (1984) as a function of stellar distance estimated using Gaia DR3 parallaxes. Horizontal bars represent the distance uncertainties for each star, while vertical arrows indicate lower (upward) or upper (downward) limits to the Na I column density. The vertical gray band marks the inferred distance to the R–C cloud (150 ± 15 pc). The systematic rise in Na I absorption beyond ∼140–160 pc indicates the onset of the cold foreground material associated with the R–C cloud, confirming that it lies farther than earlier estimates based on spectrophotometric distances.
Other Images in This Article
Show More
Copyright and Terms & Conditions
© 2026. The Author(s). Published by the American Astronomical Society.