Image Details
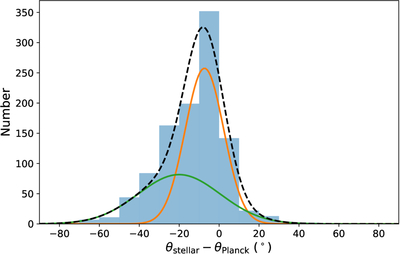
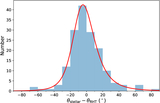
Caption: Figure 7.
Distribution of angular differences Δθ = θstellar − θPlanck using 10° bins, shown with a two-component Gaussian mixture model. Individual Gaussian components and the combined model are overplotted. The distribution peaks near Δθ ∼ −7°, indicating strong alignment between the two independent tracers of the POS magnetic field.
Other Images in This Article
Show More
Copyright and Terms & Conditions
© 2026. The Author(s). Published by the American Astronomical Society.
Copyright ©
2026 Astronomy Image Explorer. All Rights Reserved.