Image Details
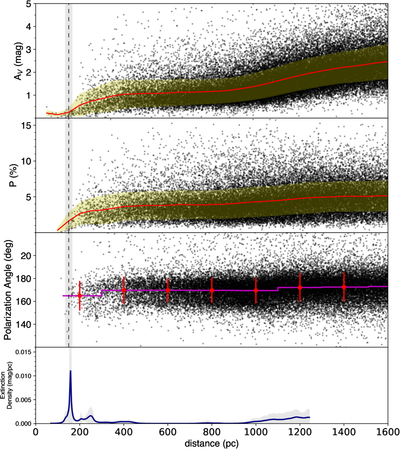
Caption: Figure 11.
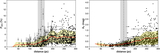
Distance dependence of extinction AV, polarization P, and polarization angle θ. The extinction and distances are taken from the STARHORSE catalog (F. Anders et al. 2022). Black points represent individual measurements; for the polarization panels, only sources with P/σP ≥ 5 are included. The red curves indicate the mean trends as a function of distance, and the shaded bands correspond to the ±1σ dispersion. In the polarization angle panel, the red points show the binned mean values with their associated uncertainties, while the magenta curve traces the overall angular trend. The vertical dashed line marks the characteristic distance of 150 pc estimated in this work, with the gray shaded region indicating its associated uncertainty. The bottom panel shows the extinction density profile from G. Edenhofer et al. (2024), where the gray shading denotes the uncertainty in the reconstructed density.
Other Images in This Article
Show More
Copyright and Terms & Conditions
© 2026. The Author(s). Published by the American Astronomical Society.