Image Details
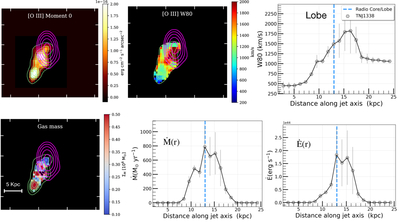
Caption: Figure 19.
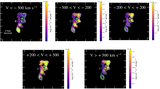
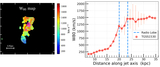
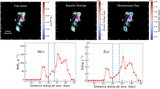
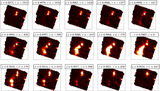
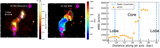
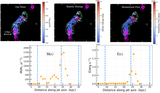
Spatially resolved [O III]λ5007 emission-line maps for TN J1338. Left: [O III] moment 0 (integrated flux) map with green contours tracing the [O III] flux and the magenta contours displaying the radio continuum levels from the VLA 4.5 GHz image (L. Pentericci et al. 2000). A significant concentration of ionized gas is observed offset from the center, near the lobe. Middle: [O III] W80 map tracing the line width, revealing localized broadening exceeding 2000 km s−1 in the vicinity of the northern radio lobe. As discussed in N. Roy et al. (2024), these broad profiles indicate strong outflows and enhanced turbulence driven by jet-ambient medium interactions near the bow shock. Right: radial profile of W80 along the jet axis, showing a ∼3× increase in line widths near the radio lobe, consistent with large-scale, lobe-associated outflows. Bottom-left, middle, and right panels show the resolved map of gas mass, radial profiles of mass outflow rates, and kinetic energy outflow rates, respectively.
Other Images in This Article
Show More
Copyright and Terms & Conditions
© 2026. The Author(s). Published by the American Astronomical Society.