Image Details
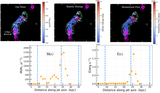
Caption: Figure 5.
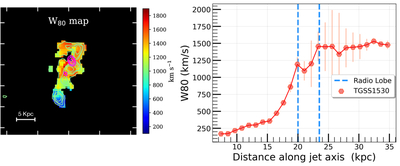
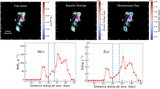
Left panel: map of W80 = v90 − v10 from Hα, a standard gas kinematic tracer, which is the line width containing 80% of the emission-line flux. Here, v90 and v10 are velocities at the 90th and 10th percentiles of the overall emission-line profile in each spaxel. Broad line widths are prevalent in the emission line-dominated nebular region coincident with the radio center. Green and magenta contours represent Hα moment 0 and radio continuum levels, respectively, similar to Figure 2. Right panel: the radial profile of W80 with distance projected along the jet axis. All spaxel positions are projected onto the radio axis in the map’s pixel coordinate system, with the zero-point of the 1D distance defined by the IFU array origin (0, 0), which by convention lies at the bottom left of the map. The locations of the two radio lobes are shown by the dashed vertical lines. The profile clearly demonstrates the pattern noticed in the 2D map: a steady increase in the line widths as we approach the northern part of the galaxy toward the radio source.
Other Images in This Article
Show More
Copyright and Terms & Conditions
© 2026. The Author(s). Published by the American Astronomical Society.