Image Details
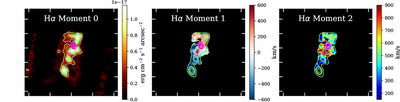
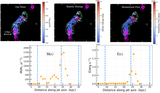
Caption: Figure 2.
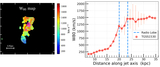
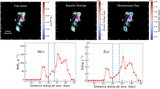
Moment 0 [left panel], moment 1 [middle panel], and moment 2 [right panel] maps of the Hα emission line of TGSS 1530. The overlaid green contours represent the 3σ, 5σ, 7σ, 10σ, and 15σ of Hα moment 0. The radio continuum contours from VLBI e-MERLIN L-band observations (K. É. Gabányi et al. 2018, 2025) are overplotted in magenta. The radio source exhibits double lobes separated by ∼400 mas. The Hα moment 1 (velocity centroid) map exhibits a sharp velocity gradient (∼800 km s−1) and transitions from blueshift to redshift around the radio lobe locations. The moment 2 values indicate broad line widths (σ > 800 km s−1), turbulent gas motions, and jet-driven outflows.
Other Images in This Article
Show More
Copyright and Terms & Conditions
© 2026. The Author(s). Published by the American Astronomical Society.