Image Details
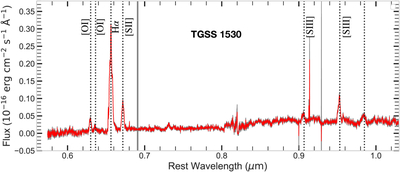
Caption: Figure 1.
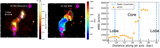
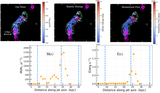
The JWST/NIRSpec IFU spectra extracted from around the detected radio core in the northern part of TGSS 1530. The spectrum shown is integrated within a box aperture of 2﹩\mathop{.}\limits^{\unicode{x02033}}﹩5 each side, centered at the location of the radio core: (232﹩\mathop{.}\limits^{\unicode{x000b0}}﹩708, 10﹩\mathop{.}\limits^{\unicode{x000b0}}﹩825). The gray-shaded region shows 1σ errors in the measured fluxes. The rest-frame optical nebular emission lines visible in the spectral window are marked by black dashed lines.
Other Images in This Article
Show More
Copyright and Terms & Conditions
© 2026. The Author(s). Published by the American Astronomical Society.
Copyright ©
2026 Astronomy Image Explorer. All Rights Reserved.