Image Details
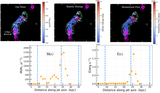
Caption: Figure 8.
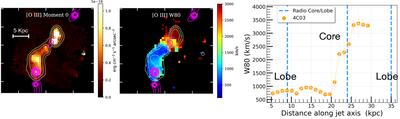
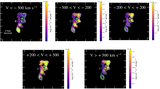
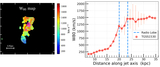
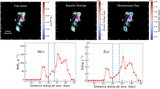
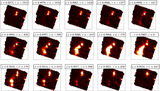
Spatially resolved maps of ionized gas in 4C03+24 traced by [O III] 5007 emission line. Magenta shows the radio continuum contours, displaying extended radio structures (W. Wang et al. 2025a). The left panel shows the [O III] moment 0 (integrated flux) map, revealing the extended ionized gas morphology aligned broadly with the radio axis. Green contours represent the [O III] moment 0 flux levels. The middle panels show [O III] W80 map, a nonparametric tracer of line width (similar to Figure 5). W80 increases drastically from the southern side of the galaxy to the northern end, peaking near the radio center. There is a moderate enhancement in line width along the southern lobe as well. The right panel displays W80 as a function of projected distance along the jet axis, with the IFU array origin (0, 0) and zero-point for the 1D-projected distance both defined at the bottom left by convention. A modest increase in W80 is observed near the southern lobe, followed by a sharp rise toward the radio core: consistent with the 2D map. These trends suggest that the ionized gas becomes progressively more kinematically disturbed along the jet axis near the radio hot spots. We hypothesize that an expanding cocoon driven by the shocked jet fluid accelerates the ambient gas outward to large velocities.
Other Images in This Article
Show More
Copyright and Terms & Conditions
© 2026. The Author(s). Published by the American Astronomical Society.