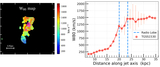
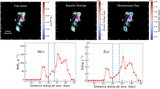
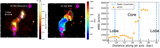
Image Details
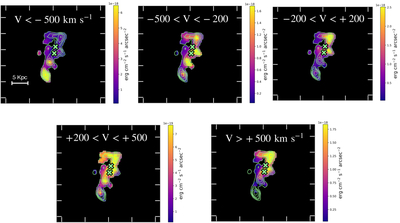
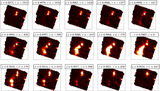
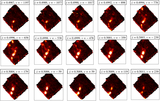
Caption: Figure 4.
Velocity channel maps of the Hα line emission in TGSS 1530. The panels show the spatial distribution of the ionized gas at different velocity intervals relative to the systemic velocity (v_sys). The top-left panel shows the high-velocity blueshifted gas (v < −500 km s−1), corresponding to the fastest approaching material along the line of sight, likely tracing the near side of an expanding outflow cone. The next four panels (top middle to bottom left) display the intermediate velocity channels within ±500 km s−1, which contain the majority of the extended ionized gas emission. The bottom-right panel shows the high-velocity redshifted gas (v > +500 km s−1), tracing the receding side of the outflow structure. The green crosses indicate the location of the compact double radio source derived from the radio VLBI observations. The overall morphology and velocity distribution are consistent with a wide-angled outflow geometry driven by an expanding cocoon of shocked gas inflated by the radio jet.
Other Images in This Article
Show More
Copyright and Terms & Conditions
© 2026. The Author(s). Published by the American Astronomical Society.