Image Details
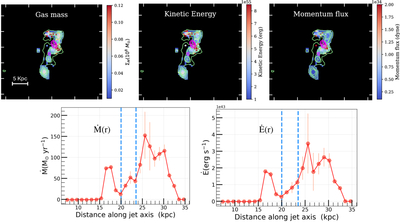
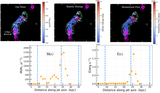
Caption: Figure 6.
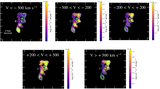
Spatially resolved maps of ionized gas mass, mass outflow rate, momentum, and outflow power in TGSS 1530, along with radial trends of mass outflow rate and outflow kinetic power shown along the jet axis. Contours follow the same convention as Figure 2. Upper left: spatially resolved map of ionized gas mass surface density, in units of 108 M⊙ per spaxel, derived from extinction-corrected Hα luminosity and electron density estimates from the [S II] doublet (see Section 3.1.3 for the details). The total ionized gas mass integrated over the whole galaxy is 1.0 × 10⁹ M⊙. Overlaid green contours correspond to Hα moment 0 flux, and the magenta contours represent the radio continuum levels. Upper middle: spatial distribution of outflow kinetic energy in units of erg. The kinetic energy peaks around the regions coincident with the radio lobes. Upper right: spatial distribution of the momentum rate in units of dyne. Bottom-left panel: the radial profile of the mass outflow rate (﹩{\dot{M}}_{{\rm{out}}}﹩ in units of M⊙ yr−1). The origin and the axis are similar to those shown in Figure 5. The left and right vertical dashed lines in the profiles indicate the locations of the southern and northern radio lobes, respectively. ﹩{\dot{M}}_{\mathrm{out}(r)}﹩ exhibits a sharp enhancement around ∼25 kpc, which is near the approximate location of the northern radio lobe. This indicates more mass is being displaced close to the northern lobe, which indicates that the radio jets are pushing into the surrounding dense gas and driving turbulence, resulting in enhanced line widths, greater gas motions, and also a larger amount of ejected mass. Bottom-right panel: the radial profile of kinetic power ﹩\dot{{E}}({r})﹩ in units of erg per second. The kinetic power shows a very similar trend to that of ﹩{\dot{M}}_{{\rm{out}}}﹩, peaking near the radio lobe. The total kinetic power integrated over the ionized outflow is ﹩K{\unicode{x00116}}_{\mathrm{outflow}}\sim 1.65\times 1{0}^{43}\,\mathrm{erg}\,{{\rm{s}}}^{-1}﹩. The measurements of total gas mass, mass outflow rate, kinetic energy, power, and momentum are provided in Table 2.
Other Images in This Article
Show More
Copyright and Terms & Conditions
© 2026. The Author(s). Published by the American Astronomical Society.