Image Details
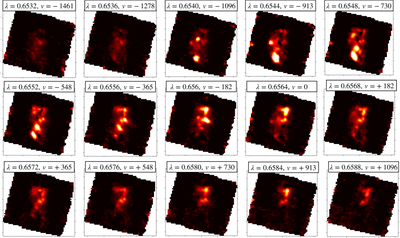
Caption: Figure 3.
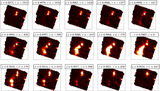
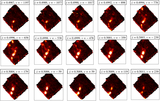
Narrowband wavelength slices of the Hα flux distribution in TGSS 1530, constructed from the NIRSpec data cube. Each panel shows the spatially resolved morphology at successive spectral slices, starting from the blueshifted side of the Hα line (λ = 0.6532 μm, v = −1461 km s−1) to the redshifted side (λ = 0.6588 μm, v = +1096 km s−1), with a Δλ = 4 Å interval (corresponding to Δv ≈ 182 km s−1). These maps reveal how the ionized gas morphology evolves across the different kinematically distinct gas components extracted from the line profile. The blueshifted slices (λ ≲ 0.6552 μm) show extended emission predominantly bright in the south of the radio nucleus, indicating high-velocity outflowing gas along that direction. At systemic and mildly redshifted velocities (λ ∼ 0.6564–0.6580 μm), the emission adopts an “8”-shaped configuration, with ionized gas distributed symmetrically about the nucleus. In the most redshifted slices (λ ≳ 0.6580 μm), the emission brightens in the northern region, spatially coincident with the location of the radio source.
Other Images in This Article
Show More
Copyright and Terms & Conditions
© 2026. The Author(s). Published by the American Astronomical Society.