Image Details

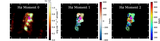
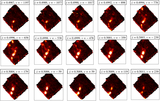
Caption: Figure 9.
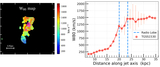
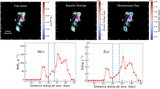
Top row (left to right): spatially resolved maps of ionized gas mass, kinetic energy, and momentum flux in 4C03+24. The color scale, units, and contour definitions follow those used in Figure 8. Bottom row: radial profiles of mass outflow rate and kinetic power along the jet axis, following the same convention as Figure 6. All spaxel positions are projected onto the radio axis, with the zero-point of the 1D distance defined by the IFU array origin (0, 0), which by convention lies at the bottom left of the map. The locations of the radio core and lobes are marked as vertical dashed lines in the radial profiles. After projection onto the jet axis, the dashed lines from left to right correspond to the southern lobe, core, and northern lobe, respectively. The radial profiles of both the mass outflow rate and kinetic power exhibit a clear enhancement by a factor of 2–3-in regions coincident with the central radio core. The total gas mass, kinetic energy, outflow rates, and momentum measurements are given in Table 2.
Other Images in This Article
Show More
Copyright and Terms & Conditions
© 2026. The Author(s). Published by the American Astronomical Society.