Image Details
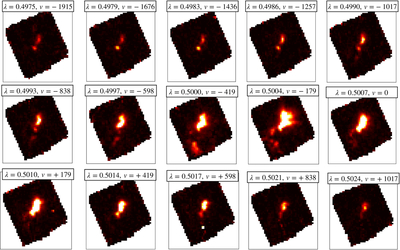
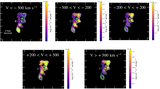
Caption: Figure 13.
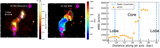
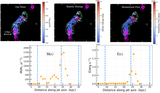
Narrowband channel maps of [O III]λ5007 emission in TN J0205+2242. The panels show flux slices along the wavelength axis from λ = 0.4975 to 0.5025 μm in 3–4 Å intervals, similar to Figure 7. At blueshifted velocities, the line emission is confined to two locations: one compact component near the radio core and an extended emission region aligned with the northern radio lobe. As velocities approach systemic and redshifted values, these regions merge into a continuous ionized bridge extending toward the southern lobe, spanning ∼ 1﹩\mathop{.}\limits^{\unicode{x02033}}﹩5–2﹩\mathop{.}\limits^{\unicode{x02033}}﹩5 (12–20 kpc). The flux increases by over an order of magnitude near systemic velocities, particularly around the denser northern lobe. The line emission remains faint toward the southern lobe, indicating lower gas density and limited jet–ISM interaction.
Other Images in This Article
Show More
Copyright and Terms & Conditions
© 2026. The Author(s). Published by the American Astronomical Society.