Image Details
Caption: Figure 7.
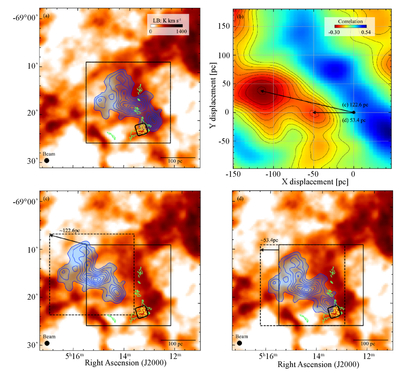
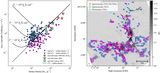
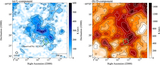
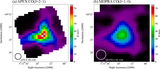
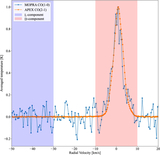
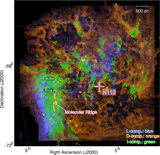
(a) H I integrated intensity map of the D-component with a velocity range of (−10, 10) km s−1 and the L-component with a velocity range of (−50, −30) km s−1, with contours overlaid. (b) The spatial distribution of the correlation coefficient was derived by repeatedly calculating the correlation between the integrated intensity maps of the L-component and the D-component while systematically shifting one map pixel by pixel along the x-direction (parallel to R.A.) and the y-direction (parallel to decl.). The lower value of the correlation coefficients indicates the regions with spatial anticorrelation, where the two components have complementary distributions. Two local minima can be seen (see the text). (c) and (d) same image as (a), but with the L-component contours displaced. The solid outlined box indicates the initial position of the L-component, and the dashed outlined box indicates the displaced positions. The yellow and green contours correspond to the ALMA+APEX 12CO(J = 2–1) and the Spitzer/IRAC 8 μm emission with contour levels of 3 σ and 5 MJy sr−1, respectively.
Other Images in This Article
Copyright and Terms & Conditions
© 2026. The Author(s). Published by the American Astronomical Society.