Image Details
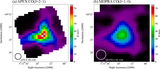
Caption: Figure 4.
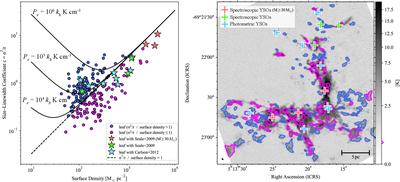
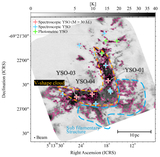
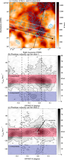
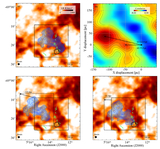
Left panel: comparison of gas surface density and size–line width coefficients (﹩{\sigma }_{v}^{2}/R﹩) for 13CO leaf structures (clumps) identified using astrodendro. Star symbols indicate leaves hosting previously identified YSOs. Among these, leaves with spectroscopically determined YSOs are shown in red if the mass of the YSO exceeds 30 M⊙, and in green if it is less than 30 M⊙. Samples without spectroscopic confirmation, for which only photometric measurements are available (YSO candidates), are shown in cyan. The black dashed line shows the relation between the surface density and the size–line width coefficient for virial equilibrium in the absence of external pressure. The black curves show the relations between the surface density and the size–line width coefficient for virial equilibrium under external pressures of Pext = 104 kB K cm−3, 105 kB K cm−3, and 106 kB K cm−3, where kB is the Boltzmann constant. Right panel: the grayscale image is the peak intensity map of 13CO(J = 2–1). Magenta and blue contours represent leaf structures in virial equilibrium with and without external pressure, respectively. Crosses are the same as in Figure 3.
Other Images in This Article
Copyright and Terms & Conditions
© 2026. The Author(s). Published by the American Astronomical Society.