Image Details
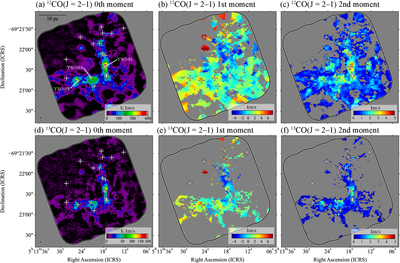
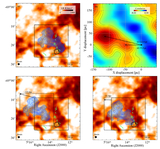
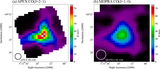
Caption: Figure 2.
The 12CO(J = 2–1) (upper panel) and 13CO(J = 2–1) (lower panel) integrated intensity (moment 0; (a) and (d)), mean velocity (moment 1; (b) and (c)), and velocity dispersion (moment 2; (c) and (f)) images of N113. The white crosses represent the positions of YSOs and YSO candidates (B. A. Whitney et al. 2008; R. A. Gruendl & Y.-H. Chu 2009; J. P. Seale et al. 2009; L. R. Carlson et al. 2012). The beam size is shown in the lower left corner of each image.
Other Images in This Article
Copyright and Terms & Conditions
© 2026. The Author(s). Published by the American Astronomical Society.
Copyright ©
2026 Astronomy Image Explorer. All Rights Reserved.