Image Details
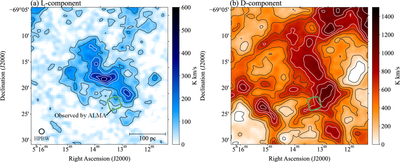
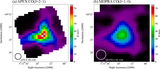
Caption: Figure 5.
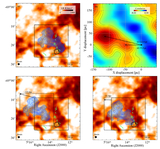
Integrated intensity maps of H I clouds around N113. The velocity range over which the emission was integrated is (−50.1, −30.5) km s−1 for the L-component (panel (a)) and (−10.4, 9.8) km s−1 for the D-component (panel (b)). The green dashed square indicates the ALMA+APEX field of view (FoV). Contours are plotted every 70 from 60 K km s–1 for (a) and 150 K km s−1from 10 K km s−1 for (b).
Other Images in This Article
Copyright and Terms & Conditions
© 2026. The Author(s). Published by the American Astronomical Society.
Copyright ©
2026 Astronomy Image Explorer. All Rights Reserved.