Image Details
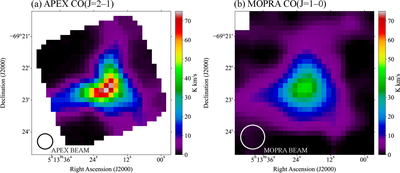
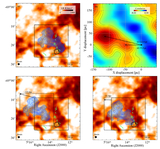
Caption: Figure B1.
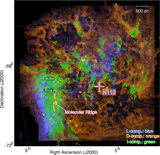
(a) Integrated intensity map of the 12CO(J = 2–1) emission obtained with APEX. (b) Integrated intensity map of the 12CO(J = 1–0) emission obtained with MOPRA. The integration velocity range is (−10, 10) km s−1 in the Voffset frame for both panels (a) and (b).
Other Images in This Article
Copyright and Terms & Conditions
© 2026. The Author(s). Published by the American Astronomical Society.
Copyright ©
2026 Astronomy Image Explorer. All Rights Reserved.