Image Details
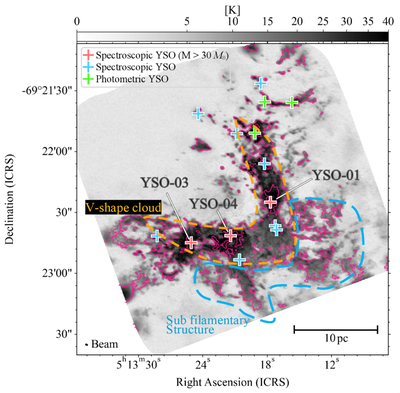
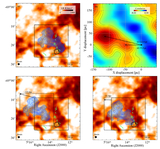
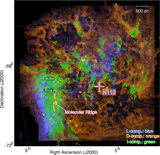
Caption: Figure 3.
An ALMA+APEX resolved molecular gas view and prominent structures in the N113 region. The grayscale image is the peak brightness temperature map of 12CO(J = 2–1). The pink contours represent the 13CO(J = 2–1) peak temperature with contour levels of 3 (∼6 × rms) and 15 K. Pink and green crosses indicate massive YSOs (J. P. Seale et al. 2009; M. Sewiło et al. 2010), with those highlighted in pink with masses exceeding ∼30 M⊙ (J. L. Ward et al. 2016). The cyan crosses indicate YSO candidates (B. A. Whitney et al. 2008; R. A. Gruendl & Y.-H. Chu 2009; L. R. Carlson et al. 2012). The beam size is shown in the lower left corner. The bright V-shaped clouds of 12CO and 13CO and several subfilamentary structures extending southwest and west are outlined with orange and cyan dashed lines, respectively.
Other Images in This Article
Copyright and Terms & Conditions
© 2026. The Author(s). Published by the American Astronomical Society.