Image Details
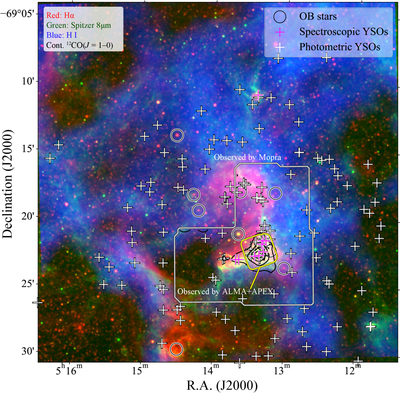
Caption: Figure 1.
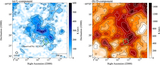
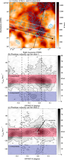
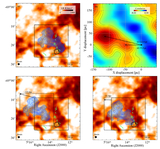
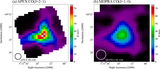
A large-scale view of the multiphase ISM toward the star-forming region N113. The three-color composite shows the MCELS Hα (red; R. C. Smith & MCELS Team 1999), Spitzer/IRAC 8 μm (green; M. Meixner et al. 2006), and H I (blue; S. Kim et al. 2003) images. Black contours represent the CO (1–0) intensity integrated over the velocity range of (−12.0, −23.0) km s−1 obtained by MOPRA (T. Wong et al. 2011, 2017). Magenta crosses, white crosses, and black circles indicate the positions of spectroscopically confirmed YSOs (J. P. Seale et al. 2009), photometric YSOs (B. A. Whitney et al. 2008; R. A. Gruendl & Y.-H. Chu 2009; L. R. Carlson et al. 2012), and W-R/OB stars (A. Z. Bonanos et al. 2009), respectively. The green box shows the coverage of our ALMA+APEX mosaics.
Other Images in This Article
Copyright and Terms & Conditions
© 2026. The Author(s). Published by the American Astronomical Society.