Image Details
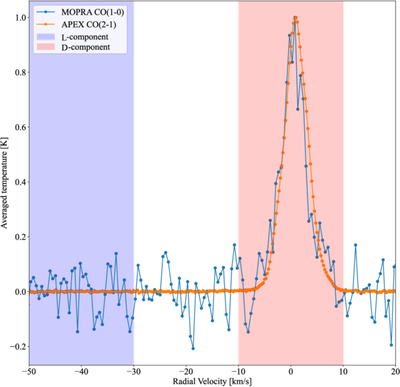
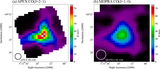
Caption: Figure B2.
Normalized spectrum of N113 GMC in 12CO(J = 2–1) and 12CO(J = 1–0) obtained with APEX and MOPRA, respectively. For the APEX data, we derived the average spectrum over the entire observed field. For the MOPRA data, only the area overlapping the APEX coverage was extracted, and the average spectrum within this region was obtained. Both spectra were normalized such that their peak intensities are unity. The red and blue transparent belts indicate the velocity range of the D-component and L-component, respectively. The two CO emission lines are located in the velocity range of the D-component.
Other Images in This Article
Copyright and Terms & Conditions
© 2026. The Author(s). Published by the American Astronomical Society.
Copyright ©
2026 Astronomy Image Explorer. All Rights Reserved.