Image Details
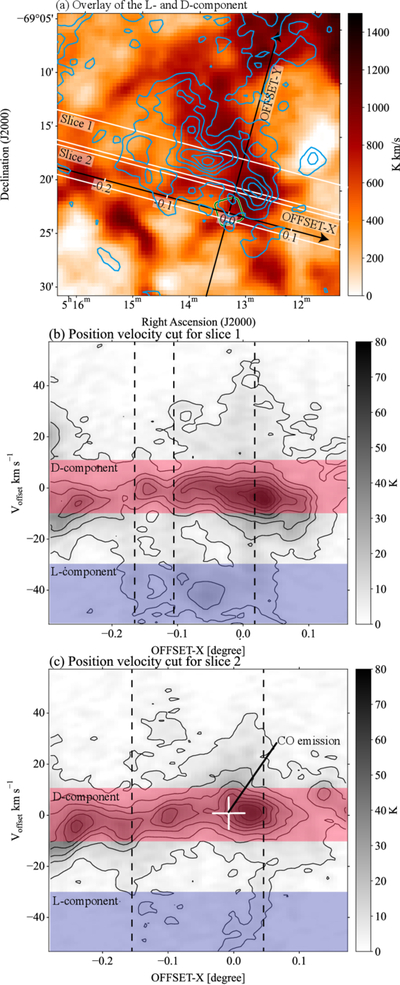
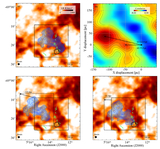
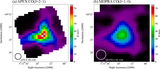
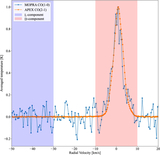
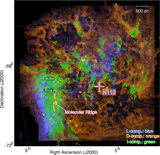
Caption: Figure 6.
(a) Integrated intensity map of H I clouds around N113 (image: D-component, contours: L-component). The green dashed square indicates the ALMA+APEX FoV. (b) H I position–velocity cut along “slice 1” indicated in (a). The diagram is along the OFFSET-X and OFFSET-Y coordinates, which are rotated 15° clockwise from the J2000 coordinate, with the rotation origin being the center of the ALMA+APEX FoV. Contours are plotted every 10 K starting at 5 K. (c) Same as (b), but for slice 2 in (a). The white cross indicates an approximate spatial and spectral extent of the CO emission in N113. The black dashed lines in the figure indicate the approximate offset-X positions where the I-component is clearly seen as a bridge connecting the L-component and the D-component.
Other Images in This Article
Copyright and Terms & Conditions
© 2026. The Author(s). Published by the American Astronomical Society.