Image Details
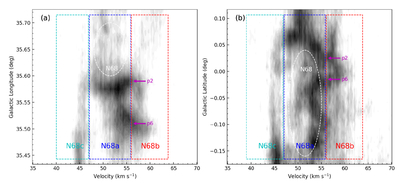
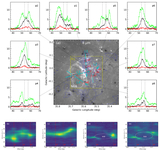
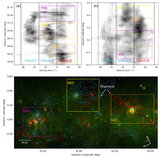
Caption: Figure 8.
PV maps of 13CO (1–0) gas of the R1 region. Panels (a) and (b) are l-PV and b-PV maps, respectively. Three prominent gas components, namely, N68a, N68b, and N68c, are highlighted by blue, red, and cyan dashed boxes, respectively. The projection of bubble N68 is depicted by a white dashed ellipse. The bridge features connecting N68a and N68b are marked by magenta arrows, which correspond to the locations of p2 and p6 in Figure 7, respectively.
Other Images in This Article
Copyright and Terms & Conditions
© 2026. The Author(s). Published by the American Astronomical Society.
Copyright ©
2026 Astronomy Image Explorer. All Rights Reserved.