Image Details
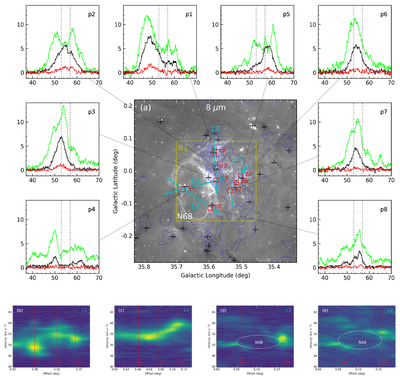
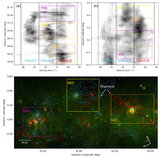
Caption: Figure 7.
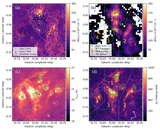
Spectra and PV slices of N68. Panel (a) shows the integrated-intensity 13CO (1–0) map of the region and the locations for extracting spectra. The contour levels start from 15 (3σ) to 55 K km s−1 in steps of 5 K km s−1 (1σ). The background image shows the 8 μm emission. The yellow box highlights the region of R1. The white dashed ellipse depicts the layout of the N68 bubble. The black pluses represent the ATLASGAL clumps. Local integrated-intensity peaks have been marked by red squares and labeled p1 to p8. 12CO (1–0) (green), 13CO (1–0) (black), and C18O (1–0) (red) spectra at each of these peak locations have been extracted. The black dashed lines are Gaussian fitting lines for 13CO spectra. Panels (b) to (e) show the PV slices along the paths L1 to L4 as shown in panel (a). The vertical dashed lines indicate the locations of local peaks on each path.
Other Images in This Article

Copyright and Terms & Conditions
© 2026. The Author(s). Published by the American Astronomical Society.