Image Details
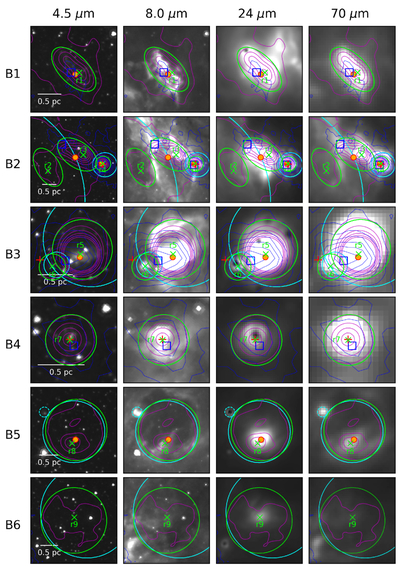
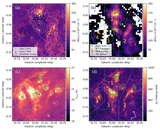
Caption: Figure 3.
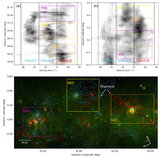
Images of zoomed-in subregions B1 to B6 (as shown in Figure 2) in different IR bands (4.5, 8.0, 24, and 70 μm, respectively). The magenta contours indicate the MAGPIS 20 cm radio continuum emission, and the green crosses and ellipses just fit the peaks and extents of their local clumpy emission. The blue contours show the ATLASGAL 870 μm emission with its peaks marked by blue squares. The cyan circles indicate the six known H II regions. The red pluses and orange dots indicate the 6.7 GHz masers and MYSOs, respectively.
Other Images in This Article

Copyright and Terms & Conditions
© 2026. The Author(s). Published by the American Astronomical Society.
Copyright ©
2026 Astronomy Image Explorer. All Rights Reserved.