Image Details
Caption: Figure 9.
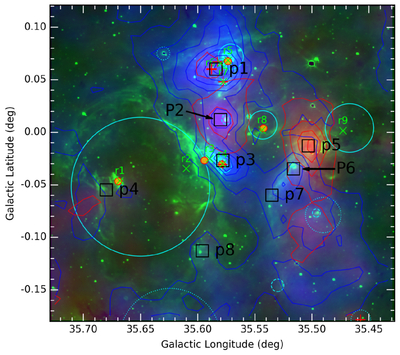
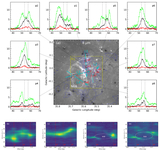
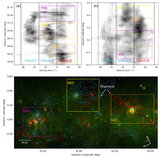
Complementary distribution of N68a and N68b. The RGB-composite map with its R, G, and B colors encoded by N65b, Spitzer − IRAC 8.0 μm, and N65a, respectively. The solid blue contours indicate the 13CO integrated-intensity map of N65a, while the dashed red contours indicate that of N65b. The contour levels in the figure are drawn from 9 (3σ) to 45 K km s−1 in steps of 6 K km s−1.
Other Images in This Article

Copyright and Terms & Conditions
© 2026. The Author(s). Published by the American Astronomical Society.
Copyright ©
2026 Astronomy Image Explorer. All Rights Reserved.