Image Details
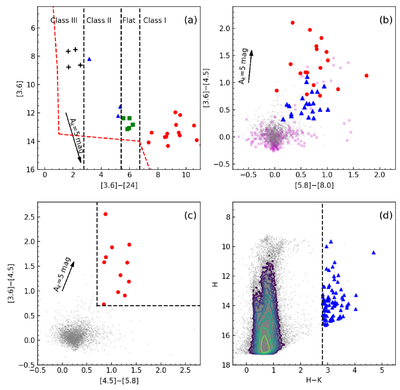
Caption: Figure 4.
YSOs classification scheme based on the NIR/MIR color–magnitude diagrams and CCDs. Panel (a) presents the [3.6] − [24] vs. [3.6] color–magnitude diagram employed in Method 1, with dashed lines separating Class I, flat-spectrum, Class II, and Class III sources following L. M. Rebull et al. (2011). Panel (b) shows the [5.8] − [8.0] vs. [3.6] − [4.5] CCD for sources detected in all four IRAC bands, with contaminants removed using the criteria of R. Gutermuth et al. (2009). Panel (c) displays the [4.5] − [5.8] vs. [3.6] − [4.5] CCD for sources detected in the first three IRAC bands, applying the selection thresholds from L. Hartmann et al. (2005) and K. V. Getman et al. (2007). Panel (d) presents the H–K vs. K CMD for sources only detected in the H and K bands; a cutoff of H–K > 2.8 mag, derived from a nearby control field, is used to identify heavily reddened Class II candidates.
Other Images in This Article

Copyright and Terms & Conditions
© 2026. The Author(s). Published by the American Astronomical Society.