Image Details
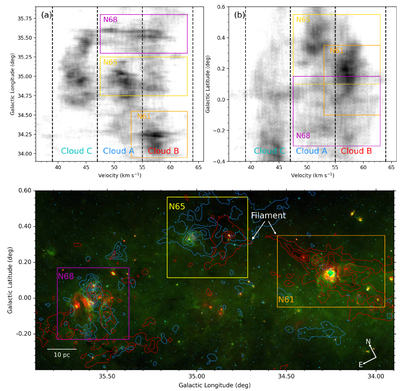
Caption: Figure 11.
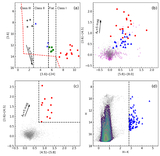
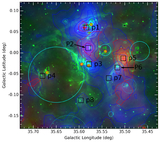
Overview of large-scale gas distribution around the G35 complex. Panels (a) and (b) are 13CO l − PV and b − PV diagrams, respectively. The vertical dashed line divided the gas into three individual components, namely, Cloud A [47, 55] km s−1 , Cloud B [55, 64] km s−1, and Cloud C [39, 47] km s−1 . The magenta, yellow, and orange boxes indicate the counterpart gas with bubbles N68, N65, and N61, respectively. Panel (c) is the 13CO gas distribution in terms of Cloud A (blue) and Cloud B (red), respectively. The three colored boxes are the regions of N68 (magenta), N65 (yellow), and N61 (orange), respectively. The background image is the RGB-composite image (R: 24 μm, G: 8.0 μm, and B: 3.6 μm).
Other Images in This Article

Copyright and Terms & Conditions
© 2026. The Author(s). Published by the American Astronomical Society.