Image Details
Caption: Figure 6.
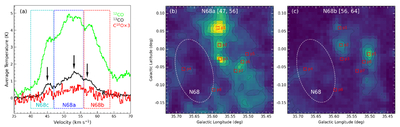
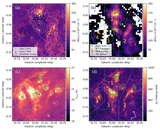
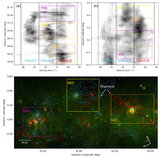
Overview of the average spectra and spatial distribution of the main components related to bubble N68. (a) shows the average spectra of the R1 region. Green, black, and red lines indicate the average spectra of 12CO, 13CO, and C18O, respectively. Blue, red, and cyan dashed boxes highlight the three main gas components, namely, N68a [47, 56], N68b [56, 64], and N68c [40, 47], respectively. Black arrows depict the system velocity for each component (i.e., 53, 57, and 45 km s−1 for N68a, N68b, and N68c, respectively). Panels (b) and (c) show the 13CO spatial distribution of N68a (integrated from 47 to 56 km s−1 ) and N68b (integrated from 56 to 64 km s−1 ), respectively. The contours are drawn at 8.1 K km s−1 (3σ) to 45.9 K km s−1 in steps of 5.4 K km s−1 (2σ). The red squares labeled p1 to p8 represent the positions of the local intensity peaks, where the spectra are extracted in Figure 7.
Other Images in This Article

Copyright and Terms & Conditions
© 2026. The Author(s). Published by the American Astronomical Society.