Image Details
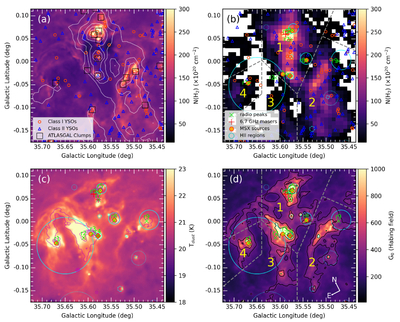
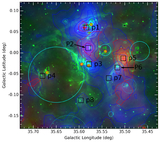
Caption: Figure 5.
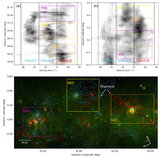
(a) Column density extracted from PPMAP. The white dotted contours indicate the 13CO moment 0 map integrated from 47 to 64 km s−1 with contour levels from 16 (3σ) to 56 K km s−1 in steps of 8 K km s−1 . The red open circles and black open triangles indicate the Class I and Class II YSOs identified in Section 3.2, respectively. The black squares indicate the ATLASGAL clumps. (b) Column density estimated from 13CO. The massive star formation signatures (6.7 GHz masers, MSX sources, and H II regions) are drawn in the same manner as in Figure 2. (c) Dust temperature extracted from PPMAP. (d) FUV field. The contour levels at G0 = 300, 500, 1000, and 3000 are drawn. The dashed lines in panels (b) and (d) divide the R1 region into four main clouds, namely, Clouds 1–4.
Other Images in This Article

Copyright and Terms & Conditions
© 2026. The Author(s). Published by the American Astronomical Society.