Image Details
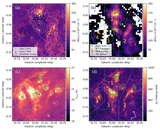
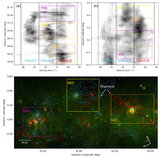
Caption: Figure 2.
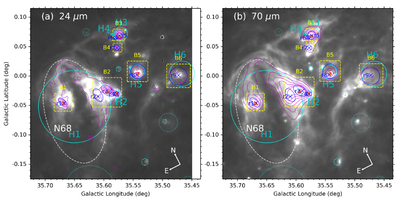
(a) Spitzer 24 μm and (b) Herschel 70 μm images with overlaid MAGPIS 20 cm contours (from 0.0008 to 0.0088 in steps of 0.0016 Jy beam−1) and NVSS 21 cm contours (from 0.02 to 0.22 in steps of 0.04 Jy beam−1) in magenta, respectively. The blue crosses and ellipses represent the peaks (markers from r1 to r9) and extents of the local clumps of the 20 cm radio continuum emission, respectively. These subregions are highlighted by yellow boxes with markers from B1 to B6. The known H II regions are fitted by cyan circles with markers from H1 to H6. The other symbols are drawn in the same manner as in Figure 1.
Other Images in This Article

Copyright and Terms & Conditions
© 2026. The Author(s). Published by the American Astronomical Society.