Image Details
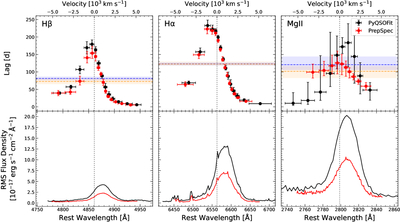
Caption: Figure 9.
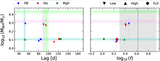
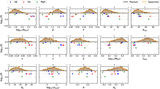
Top: a comparison of the velocity-resolved lags from the BRAINS runs using the PyQSOFit-reduced (black) and PrepSpec-reduced (red) spectra for each line in the full state. The blue (orange) horizontal lines and shaded regions represent the integrated lag and its uncertainties for the PyQSOFit (PrepSpec) data. Bottom: the rms spectrum for each line in the low state using the PyQSOFit-reduced and PrepSpec-reduced spectra. The difference between the two is attributed to the lack of correction for redshift in flux in PrepSpec.
Other Images in This Article
Copyright and Terms & Conditions
© 2025. The Author(s). Published by the American Astronomical Society.
Copyright ©
2026 Astronomy Image Explorer. All Rights Reserved.