Image Details
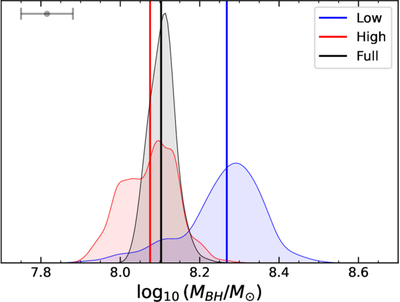
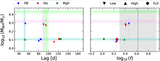
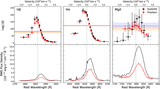
Caption: Figure 3.
The joint posterior (i.e., combining the posteriors for each of the three lines—PHα · PHβ · PMgII) for MBH for each state. Each posterior has been produced using a Gaussian kernel density estimation (KDE). Vertical lines represent the median value for the corresponding posterior. The gray data point in the top left represents the average error in the median estimate across all states.
Other Images in This Article
Copyright and Terms & Conditions
© 2025. The Author(s). Published by the American Astronomical Society.
Copyright ©
2026 Astronomy Image Explorer. All Rights Reserved.