Image Details
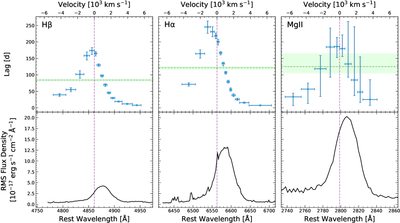
Caption: Figure 6.
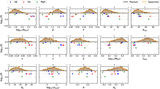
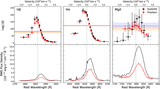
Top: the distribution of rest-frame lags output from the model as a function of wavelength for each of the three lines in the full state. The green dotted horizontal line represents the lag over the entire wavelength range, with the 16th–84th percentile range shaded in light green. The vertical dashed purple line indicates the central wavelength of the line. Bottom: the rms line profile for each of the three lines in the full state.
Other Images in This Article
Copyright and Terms & Conditions
© 2025. The Author(s). Published by the American Astronomical Society.
Copyright ©
2026 Astronomy Image Explorer. All Rights Reserved.