Image Details
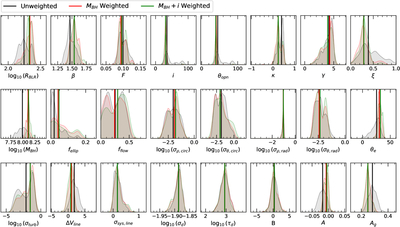
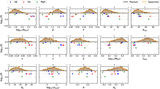
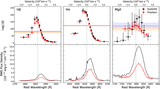
Caption: Figure 2.
The output posterior distributions for all BRAINS parameters, using different weighting schemes, for Hβ in the full state. Posteriors have been produced with a Gaussian KDE. Vertical lines in each of the panels represent the weighted median values from the posterior samples for a given line. We opt to use the MBH-weighted posterior, shown in red, as it enforces the same MBH across lines and sufficiently constrains the posterior distribution.
Other Images in This Article
Copyright and Terms & Conditions
© 2025. The Author(s). Published by the American Astronomical Society.
Copyright ©
2026 Astronomy Image Explorer. All Rights Reserved.