Image Details
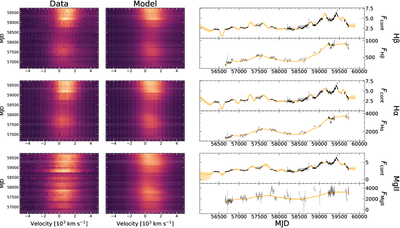
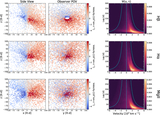
Caption: Figure 4.
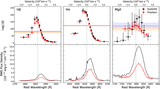
Comparison of BRAINS output for the full state for all lines. Left: input and model-reconstructed multiepoch spectra. The model spectra are generated using the maximum (weighted) probability parameters. Right: fits to the continuum and line light-curve data from the model. The weighted median light-curve fit is shown as an orange line, while the weighted 16th–84th percentile range of all posterior sample light-curve fits is shaded in light orange. The uncertainties of the emission line light-curve fits are small, and may not be visible. The error bars for the line light curves are adjusted using the weighted median σsys,line and the temperature used ﹩(\sqrt{T})﹩.
Other Images in This Article
Copyright and Terms & Conditions
© 2025. The Author(s). Published by the American Astronomical Society.