Image Details
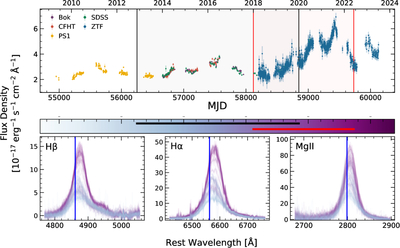
Caption: Figure 1.
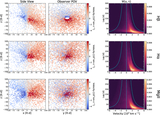
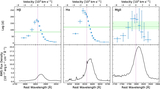
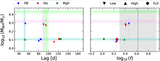
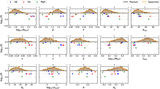
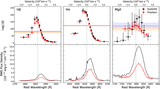
Top: the continuum light curve for RM160, color coded by data set. The time period for the low (high) state is shown shaded in black(red). Bottom: the PyQSOFit-processed, calibrated line profiles for all observations of the lines, color coded by the observed MJD. The color bar has the same date range as the continuum panel, and the low (high) state range is shown with the bold black (red) line. The systemic redshift of RM160 is based on the peak of [O III] λ5007. We leave overlap in the two states to improve statistical constraints.
Other Images in This Article
Copyright and Terms & Conditions
© 2025. The Author(s). Published by the American Astronomical Society.
Copyright ©
2026 Astronomy Image Explorer. All Rights Reserved.