Image Details
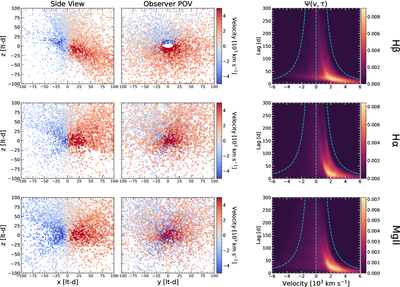
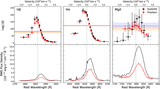
Caption: Figure 5.
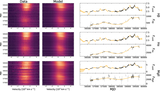
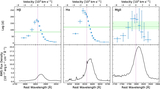
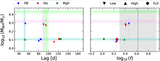
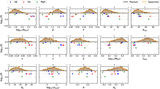
Comparison of BRAINS output for the full state for all lines. Top left: cloud configurations generated by the best-fit parameters for each run. Two points of view are shown for each cloud configuration, along and perpendicular to the observer’s LOS. The clouds are colored by their LOS velocity to the observer. Cloud size is assigned by its emissive weight, determined by the model parameter κ. Bottom right: transfer functions Ψ(v, τ) generated using the best-fit model parameters for each line. The cyan dashed line represents the virial envelope, using the best-fit MBH, as well as v = 0. Many models produce transfer functions with an asymmetric distribution, concentrated near large positive (i.e., red) velocity shifts, due to the large fraction of inflowing BLR clouds. A Plotly interactive version of this figure is available in the online journal. The cloud configurations can be changed via toggle buttons. Users can rotate and zoom in each panel. Users can zoom in on the data in the transfer function panels. All of the functionality is controlled via buttons in the upper right corner. The data is available in Z. Stone & Y. Shen (2025).
An interactive version of this figure is available in the online article.
An interactive version of this figure is available.
An interactive version of this figure is available in the online journal.
Other Images in This Article
Copyright and Terms & Conditions
© 2025. The Author(s). Published by the American Astronomical Society.