Image Details
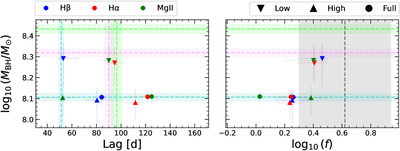
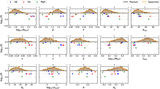
Caption: Figure 7.
A comparison of the obtain values for MBH, τ, and f for all considered lines and states. The color (shape) of each data point determines its line (state), following the legend in the upper left (right). The cyan, pink, and lime vertical and horizontal dashed lines represent the published values for each variable from S24 using Hβ, Hα, and Mg II, respectively. The shaded regions for these dashed lines represent the uncertainties in these published values. The vertical black dashed line and gray shaded region around it represent the published value and uncertainty for f from S24.
Other Images in This Article
Copyright and Terms & Conditions
© 2025. The Author(s). Published by the American Astronomical Society.
Copyright ©
2026 Astronomy Image Explorer. All Rights Reserved.