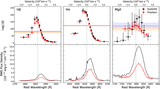
Image Details
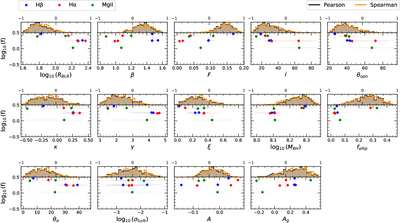
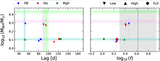
Caption: Figure 8.
Correlations of the virial factor ﹩{\mathrm{log}}_{10}(f)﹩ to model parameters. Values of f are color coded by their emission line. Each panel contains a scatterplot of f against the model parameter (bottom) and histograms of the distributions of Pearson r and Spearman ρ coefficients Top: distributions for these coefficients are obtained by drawing 500 realizations of f and a given model parameter using their uncertainties.
Other Images in This Article
Copyright and Terms & Conditions
© 2025. The Author(s). Published by the American Astronomical Society.
Copyright ©
2026 Astronomy Image Explorer. All Rights Reserved.