Image Details
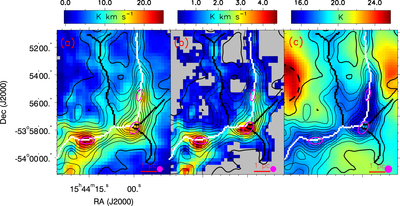
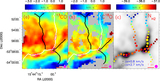
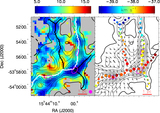
Caption: Figure 3.
(a) Velocity integrated intensity map of 13CO (J = 2–1) with the H2 column density determined from spectral energy distribution fitting overlaid as contours in levels of (0.9, 1.1, 1.3, 1.5, 1.9, 2.4, 3.0, 4.0, and 5.0) × 1022 cm−2. The velocity interval for integration is [−41.5, −33.0] km s−1. The σ levels of the 13CO (J = 2–1) integrated map is σ = 0.08 K km s−1. The main and branched skeletons are shown as white and black curves, respectively. Magenta ellipses mark the dust clumps. The filled magenta circle in the lower right corner indicates the beam size (HPBW) of the CO observation. (b) Same as panel (a), but for C18O (J = 2–1). (c) Same as panel (a), but for dust temperature. The filled magenta circle in the lower right corner indicates the beam size of the Herschel 500 μm wave band.
Other Images in This Article
Show More
Copyright and Terms & Conditions
© 2023. The Author(s). Published by the American Astronomical Society.