Image Details
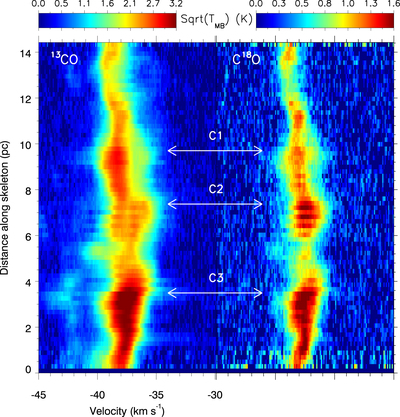
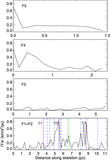
Caption: Figure 9.
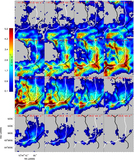
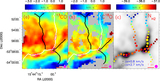
Left: 13CO position–velocity diagram as a function of the distance along the main skeleton (see Figure 5) from the southern to northern end. The color scale is displayed after taking the square root. The white arrows represent the positions of C1, C2, and C3. Right: same as the left panel, but for C18O.
Other Images in This Article
Show More
Copyright and Terms & Conditions
© 2023. The Author(s). Published by the American Astronomical Society.
Copyright ©
2026 Astronomy Image Explorer. All Rights Reserved.