Image Details
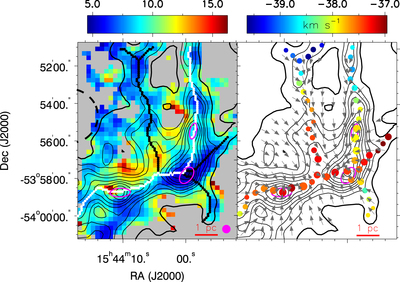
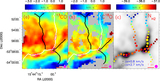
Caption: Figure 10.
Left: maps of the 13CO/C18O abundance ratio obtained from the 13CO and C18O J = 2–1 lines assuming LTE. Contours are the H2 column density in levels of (0.9, 1.1, 1.3, 1.5, 1.9, 2.4, 3.0, 4.0, and 5.0) × 1022 cm−2. Magenta ellipses mark the dust clumps. Part of the black dashed circle indicates the infrared bubble MWP1G326725+007745. The main and branched skeletons are shown as white and black curves, respectively. The beam size of the CO observation is shown in the lower right corner. Magenta ellipses mark the dust clumps. Right: projected local gravitational field (gray arrows) overlaid on the H2 column density contours in levels of (0.9, 1.1, 1.3, 1.5, 1.9, 2.4, 3.0, 4.0, and 5.0) × 1022 cm−2 and the color-coded velocity centroids of C18O (J = 2–1). The sizes of the symbols indicate the line width of C18O (J = 2–1). The gravitational force vectors are displayed with uniform lengths to emphasize their directions.
Other Images in This Article
Show More
Copyright and Terms & Conditions
© 2023. The Author(s). Published by the American Astronomical Society.