Image Details
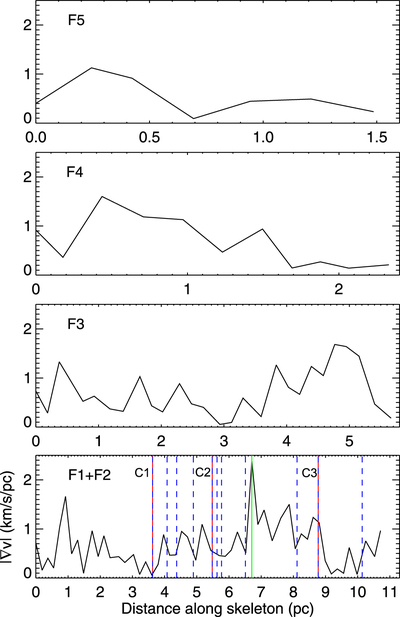
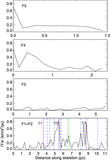
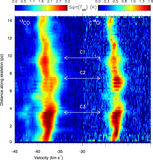
Caption: Figure 7.
The absolute velocity gradient along each skeleton, computed over ∼0.19 pc, is plotted as a function of position relative to the centers of the filaments for F3, F4, and F5. The major branch, F1+F2, is plotted from north to southeast. Red vertical solid lines represent the three ATLASGAL clumps. Blue vertical dashed lines indicate the positions of the 11 compact ArTéMiS sources situated in the F1+F2 skeleton. The green vertical solid line indicates the position of the junction between F3 and the major branch of filaments.
Other Images in This Article
Show More
Copyright and Terms & Conditions
© 2023. The Author(s). Published by the American Astronomical Society.
Copyright ©
2026 Astronomy Image Explorer. All Rights Reserved.