Image Details
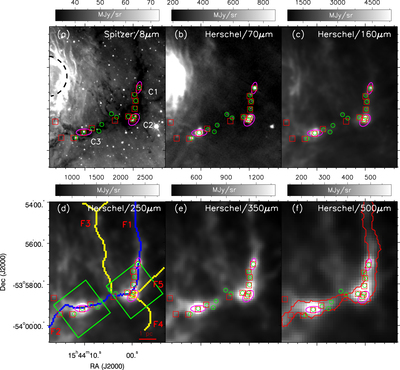
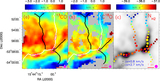
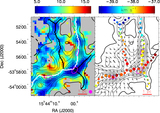
Caption: Figure 1.
Morphology of G326 seen at Spitzer 8 μm and Herschel 70, 160, 250, 350, and 500 μm. The green circles, magenta ellipses, and red rectangles mark the Herschel 70 μm point sources, the dust clumps (Urquhart et al. 2014a), and the compact ArTéMiS sources (Peretto et al. 2020), respectively. In panel (a), part of the black dashed circle indicates the infrared bubble MWP1G326725+007745 (Simpson et al. 2012). The dust clumps are referred to as C1, C2, and C3. In panel (d), two green rectangles show the areas covered by the Millimetre Astronomy Legacy Team 90 GHz (MALT90) Survey (Jackson et al. 2013). The five subfilaments are referred to as F1, F2, F3, F4, and F5. The major branch of filaments, composed of F1 and F2 (longest, and represented as F1+F2 in Table 2), and branched skeletons are shown as blue and yellow curves, respectively. In panel (f), the outlined subregion is the masking area used in the algorithm FilFinder (Koch & Rosolowsky 2015) and is used to trace the major branch of the filaments.
Other Images in This Article
Show More
Copyright and Terms & Conditions
© 2023. The Author(s). Published by the American Astronomical Society.