Image Details
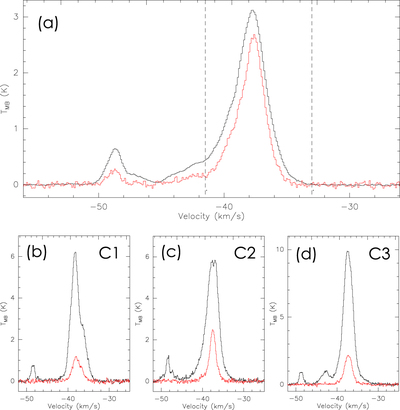
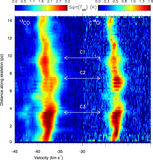
Caption: Figure 2.
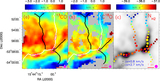
(a) Averaged spectra of 13CO (J = 2–1) (black) and C18O (J = 2–1) (red) over the hub–filament cloud of G326. The intensity of C18O (J = 2–1) has been reduced by a scale factor of 5 for ease of viewing. The vertical dashed lines show the velocity interval −41.5 to −33.0 km s−1 over which the infrared dark hub–filament cloud of G326 extends. (b) Beam-averaged spectra of 13CO (J = 2–1) (black) and C18O (J = 2–1) (red) for C1. (c) Same as panel (b), but for C2. (d) Same as panel (b), but for C3.
Other Images in This Article
Show More
Copyright and Terms & Conditions
© 2023. The Author(s). Published by the American Astronomical Society.
Copyright ©
2026 Astronomy Image Explorer. All Rights Reserved.